Science Brief: Ultra-low Frequency (ULF) Pulses
Background:
How can you “hear” earthquakes before they happen? What type of signal could conceivably penetrate 10-100km of solid rock?
Early clues started appearing in many countries in the 20th century. For example, amateur radio people (e.g. “ham radio operators”) detected some unusual radio “static” prior to the 1960 M9.5 quake in Chile. Others proposed that if there were an electromagnetic signal deep in the earth, then one might detect it at the far low end of the electromagnetic spectrum, i.e. the ultra low frequency (ULF) or 0.01 to 3 Hz band because the longer the wavelength, the deeper the signal can penetrate the ground.
Recent History:
Stanford University was conducting some research in the 1980’s looking for a part of the radio spectrum where communications might work best for communicating with submarines while they were still underwater (conductive salt water). Since the electric field antenna would need to be thousands of miles long to receive ULF, they decided to try using an induction magnetometer to detect the magnetic portion of the ULF signals. Using such a magnetometer in Corralitos, CA, an ultra low frequency (ULF) signal was detected 2 weeks prior to the 1989 Loma Prieta, Ca. M7.1 Earthquake (Ref A. Fraser-Smith, Stanford). This signal was captured using 30 minute averages and the raw data was not stored. It represented a single piece of evidence with no identical instrument close by for verification. The signal averaging also did not allow the community to see the actual signal waveform and timing.
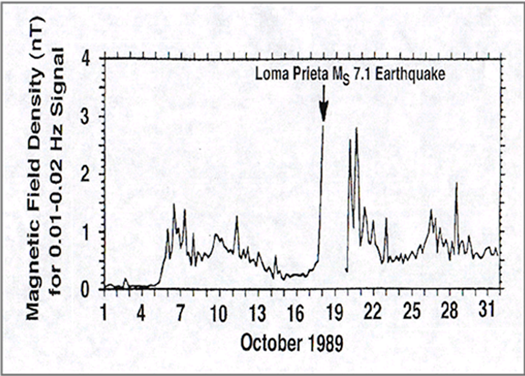
Figure 1 Loma Prieta earthquake signal taken at 0.01 Hz band.
All the energy bands from 0.01 Hz to 10 Hz demonstrated increases in energy, but this band (0.01Hz) was the most dramatic.
Refining the Algorithms:
QuakeFinder started installing and operating magnetometers in 2000, and eventually installed over 60 instruments with 3 axis induction magnetometers. Finally in 2007, QuakeFinder detected ULF signals within 2 miles of a M5.4 quake in Alum Rock near San Jose CA. The use of raw data collected at 40-50 samples per sec allowed us to “see” the actual waveforms of the magnetic signals, and they looked like short (0.5 to 10 sec.) “uni-polar pulses” that occurred typically around 1-10 times a day on a normal day, to over several hundreds of times around 2 weeks prior to an earthquake greater than M4.5. Comparisons of QuakeFinder data, using similar 30 minute energy averages at 0.01 Hz, are very similar (but not identical) to the Loma Prieta data. The main conclusion is that using 30 minute averages were a good start, but they severely restrict the detection (and counting) of the unique and short lived uni-polar pulses.
Another more recent piece of evidence is shown below in Figure 2, showing a 60 second signal taken at 50 samples per sec. and showing a series of random, “uni-polar” (mostly positive) pulses approximately 1-2 sec in duration. These pulses have been detected at all the earthquakes detected by this team, including the Alum Rock, Ca. (M5.4 2007) and Tacna and El Carmen, Peru earthquake clusters. Other “noise” signals include solar-generated Pc3 micropulsations.
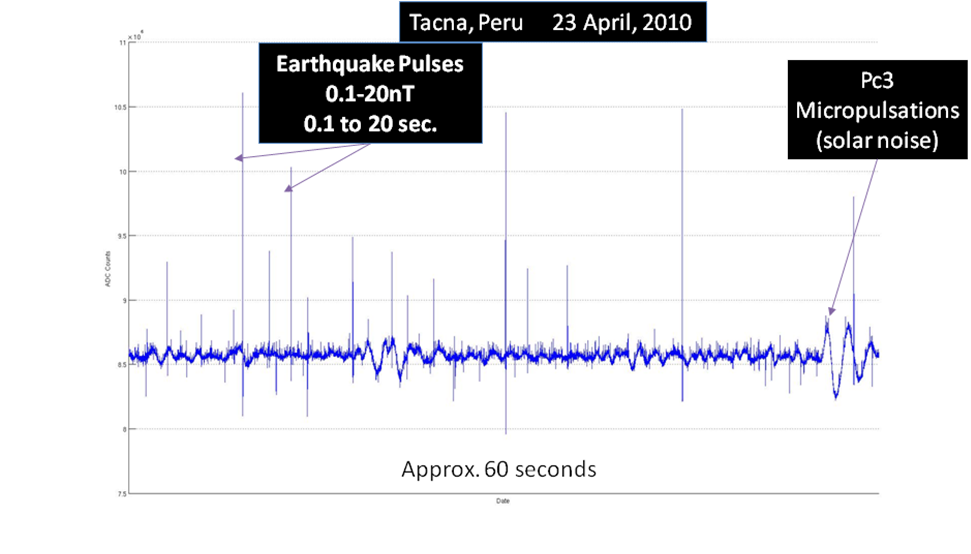
Figure 2 Sample “uni-polar” pulses as detected at Tacna Peru, 13 days prior to a M6.2 earthquake
Alum Rock Data:
These “uni-polar “pulses have been seen prior to many quakes, but the discriminator that ties the pattern to an impending quake is that the amplitude and frequency of occurrence of the pulses increase in each of 3 or more adjacent days. The small figures in the upper left of the Figure 3 (below) shows how “pulse thresholds” are set for both positive and negative pulse waveforms. Each pulse that exceeds the threshold without being a pulse train (oscillatory pattern) is counted and the totals for the day are plotted (Y axis is pulse count). Figure 3 illustrates another important aspect of the evidence, namely that it is important to plot several years of data to determine if the increased pulse counts are unusual and unique prior to an earthquake. It can be seen that the Calaveras Fault (Alum Rock M5.4 Oct 30, 2007 quake) was moving and causing episodes of stress change and increased pulse counts during the entire 2 year period. The “discriminator” is the occurrence of several days of sustained pulse activity that appears to show a change in the pattern, and an “avalanche” of stress change is occurring. After the quake, the pulse pattern drops back to a “normal” level.
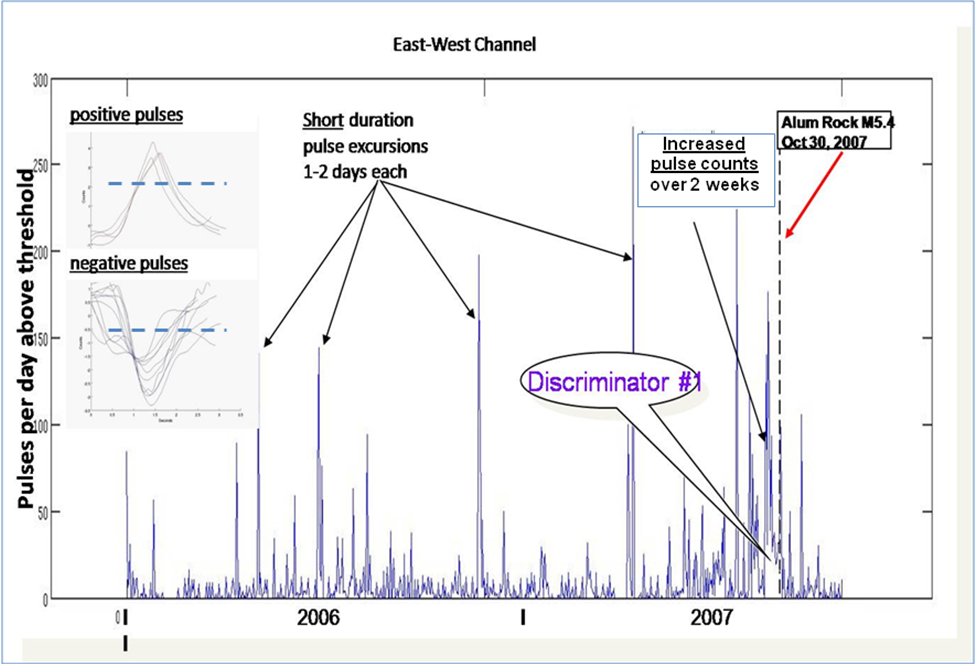
Figure 3 Sample plot of pulse counts where the individual positive and negative pulses are counted each day and plotted to determine trends
A major goal is to correlate these pulses to some other manifestation of stress change. We are currently trying to determine if there is any correlation between GPS-derived vertical movement of the plates and the time of an increased pulse count prior to an earthquake event.
Tacna, Peru Data:
The previous figure illustrated the first documented pattern of earthquake pulses prior to a medium quake. In 2008, Quakefinder started a collaboration with the Catholic University in Lima Peru (PUCP, and as a result of that joint effort, we installed 2 sites in Peru, one at El Carmen (Lat -13.493812°, Long -76.059764°), and Tacna (Lat -18.266559°, Long -70.411509°). These two sites coincidentally are at the extreme north and south (respectively) of one segment of the Nazca Plate that is subducting under the South American Plate, and both areas are expected to have major quake activity. Figure 4 shows the pulse count plot from the start of the Tacna site, through November 10, 2010.
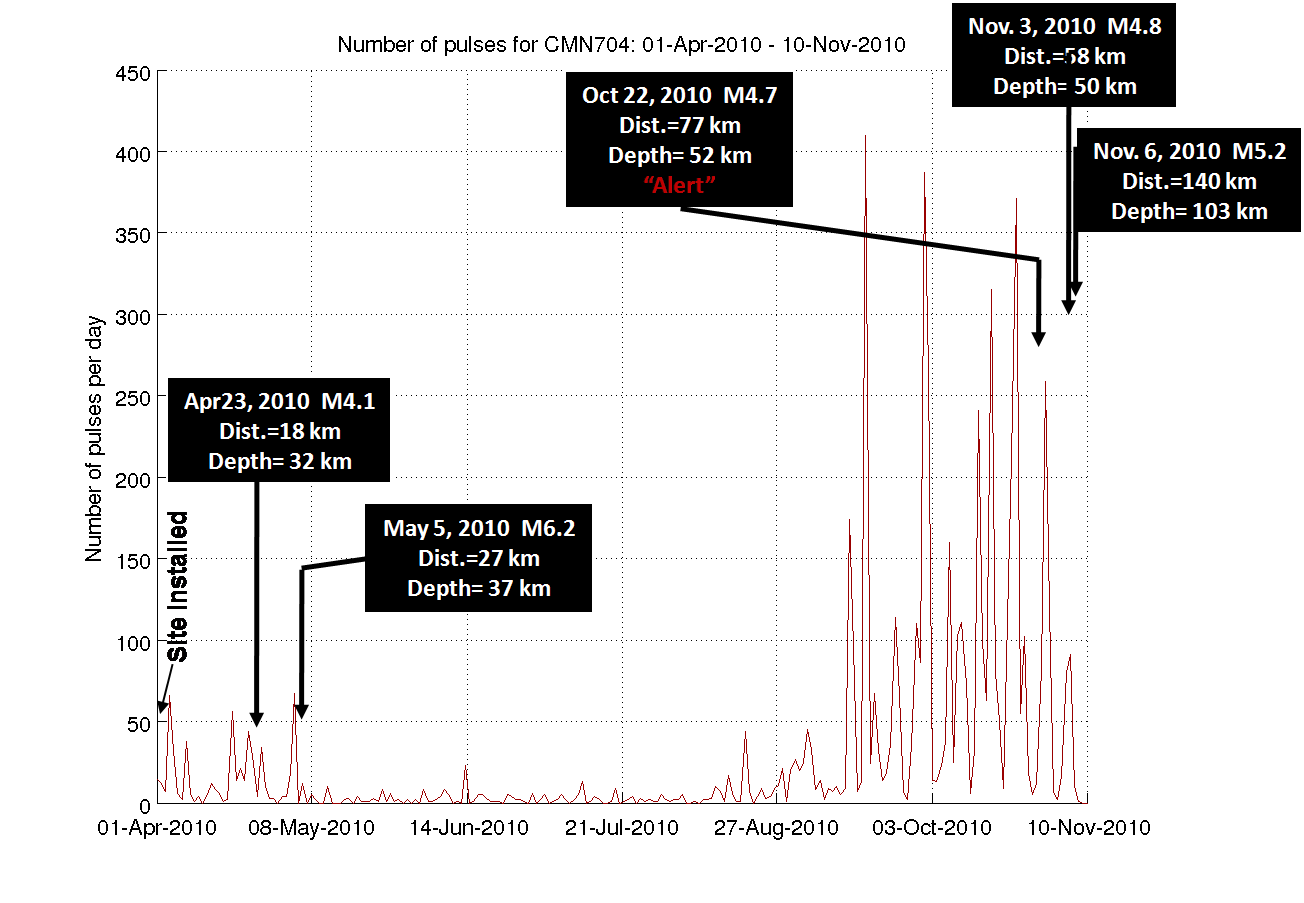
Figure 4 Pulse activity for Tacna, Peru showing a cluster of 5 earthquakes and corresponding pulse clusters
Tacna, Peru had 2 subsequent clusters of pulse activity as shown in Figure 4 above. The first culminated in a M6.2 quake on May 5, 2010. The second cluster started around Sept 16, 2010 and was significantly large, but not “sustained” across adjacent days. The result was not a large earthquake, but rather a series of smaller quakes. This was encouraging to see the correlation of pulse activity with earthquake clusters, but it made it difficult to forecast the magnitude of the expected quake. PUCP (Jorge Heraud) did send out an “Alert” on Mon, 18 Oct 2010 17:20:26 -0500 (PET) to the Vice Rector of PUCP, indicating some expected quake activity near the site around Tacna. Three subsequent quakes occurred on Oct 22 (M4.7), Nov. 3 (M4.8), and Nov 6 (M5.2), although the last quake was 140km away from the site and may be difficult to prove that it was detected as a separate part of the cluster.
El Carmen, Peru data:
The El Carmen site also showed a simultaneous pattern of pulse activity at the north end of the plate segment. The site was installed earlier, but it was unfortunate that a nearby chicken farm used the road adjacent to the site as a path for their tractor movements. The resulting noise from these magnetically active tractors caused the daily pulse counts to be high during daylight hours. The plot of pulse count in Figure 5 shows a level of approximately 300 pulses per day as the baseline noise traffic using a simple pulse counter algorithm. (We are developing a more sophisticated algorithm that will filter out these tractor pulses.) Even with the high noise at the site, a distinct increase in pulse count can be seen starting around Sept 16, 2010.
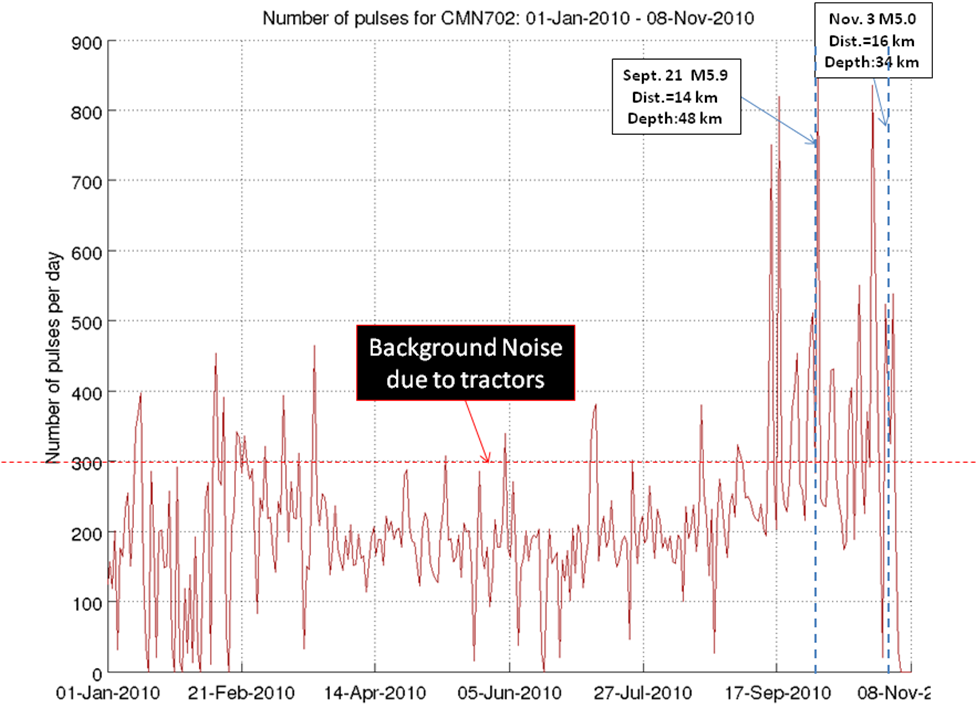
Figure 5 Pulse activity at El Carmen, Peru
We have not determined if the two quake clusters are related since they started around the same time, although they are almost 800km apart. The solar activity (Kp) was low during these episodes, and there was no known other source of these pulse activity. More analysis is being done to determine if there is a mechanical (Nazca plate) connection to these episodes.